What is missing?
May 16, 2012 12:10 am • Permalink 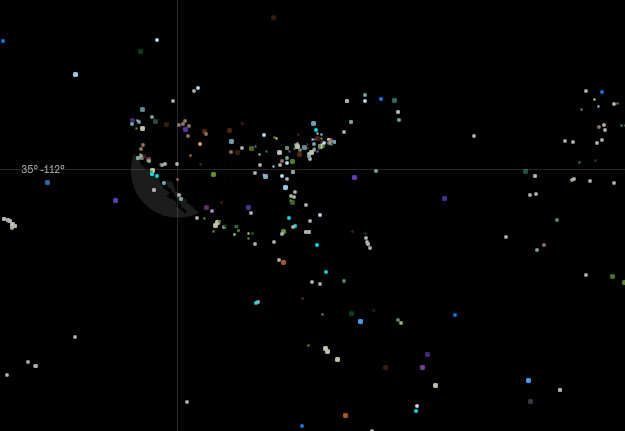
What is Missing? by Maya Lin seeks to raise awareness about the mass extinction of species. It has a beautiful interface. The world map is black on a sea of black. Your mouse acts as a sort of flashlight layered between land and water, showing you glimpses of familiar coastlines and allowing you to select dots that tell the stories of extinction.
We are experiencing the sixth mass extinction in the planet's history, and the only one to be caused not by a catastrophic event, but by the actions of a single species - mankind. On average, every 20 minutes a distinct living species of plant or animal disappears. At this rate, by some estimates, as much as 30 percent of the world's animals and plants could be on a path to extinction in 100 years.
The site states that the dots on the world map each represent a species, place, or natural phenomenon that has disappeared or significantly diminished. Unfortunately, this is a very vague concept. I chose a dot titled "Earth" that described the abundance of life in a cup of soil. Another dot named "Migration" discussed how the natural phenomenon of migration was disappearing around the world. It seemed so loosely related to extinction that I felt the mission of the piece fell short. You can also view the dots by year, however, I felt it only added to my confusion because it doesn't seem to chronicle actual extinctions.
I typically love Maya Lin's work, so this site was surprisingly disappointing and certainly not her best piece of data visualization (see Vietnam Veterans Memorial).

How to Visualize and Compare Distributions
May 15, 2012 10:47 pm • Permalink 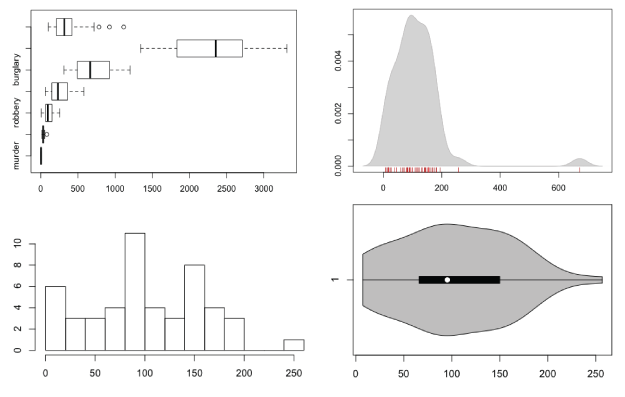
There are a lot of ways to show distributions, but for the purposes of this tutorial, I'm only going to cover the more traditional plot types like histograms and box plots. Otherwise, we could be here all night. Plus the basic distribution plots aren't exactly well-used as it is.
Before you get into plotting in R though, you should know what I mean by distribution. It's basically the spread of a dataset. For example, the median of a dataset is the half-way point. Half of the values are less than the median, and the other half are greater than. That's only part of the picture.
What happens in between the maximum value and median? Do the values cluster towards the median and quickly increase? Are there are lot of values clustered towards the maximums and minimums with nothing in between? Sometimes the variation in a dataset is a lot more interesting than just mean or median. Distribution plots help you see what's going on.
Want more? Google and Wikipedia are your friend.Anyways, that's enough talking. Let's make some charts.
If you don't have R installed yet, do that now.
Box-and-Whisker Plot
This old standby was created by statistician John Tukey in the age of graphing with pencil and paper. I wrote a short guide on how to read them a while back, but you basically have the median in the middle, upper and lower quartiles, and upper and lower fences. If there are outliers more or less than 1.5 times the upper or lower quartiles, respectively, they are shown with dots.
The method might be old, but they still work for showing basic distribution. Obviously, because only a handful of values are shown to represent a dataset, you do lose the variation in between the points.
To get started, load the data in R. You'll use state-level crime data from the Chernoff faces tutorial.
# Load crime data crime <- read.csv("http://datasets.flowingdata.com/crimeRatesByState-formatted.csv") Remove the District of Columbia from the loaded data. Its city-like makeup tends to throw everything off.
# Remove Washington, D.C. crime.new <- crime[crime$state != "District of Columbia",]
Oh, and you don't need the national averages for this tutorial either.
# Remove national averages crime.new <- crime.new[crime.new$state != "United States ",]
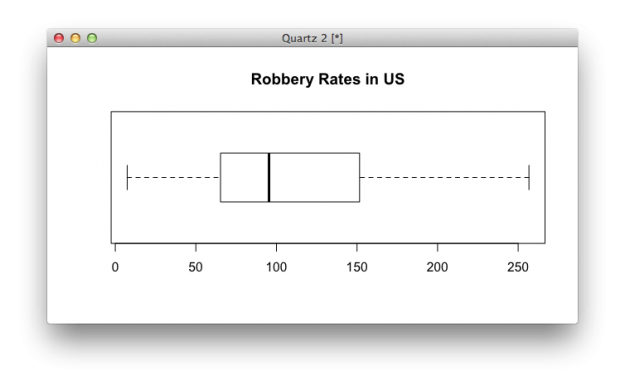
Now all you have to do to make a box plot for say, robbery rates, is plug the data into boxplot().
# Box plot boxplot(crime.new$robbery, horizontal=TRUE, main="Robbery Rates in US")
Want to make box plots for every column, excluding the first (since it's non-numeric state names)? That's easy, too. Same function, different argument.
# Box plots for all crime rates boxplot(crime.new[,-1], horizontal=TRUE, main="Crime Rates in US")
Multiple box plot for comparision.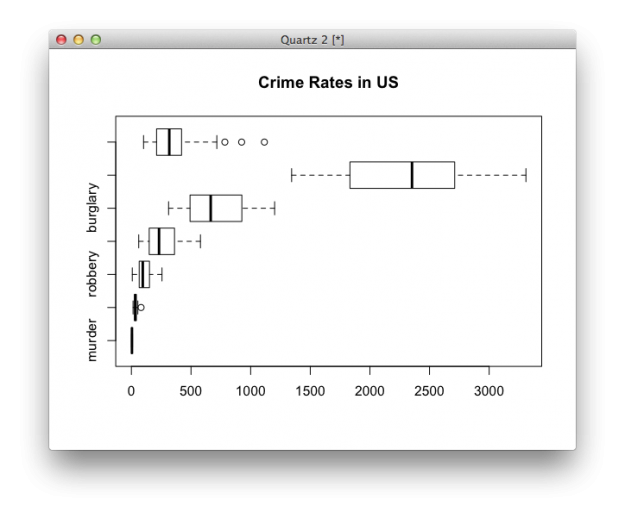
Histogram
Like I said though, the box plot hides variation in between the values that it does show. A histogram can provide more details. Histograms look like bar charts, but they are not the same. The horizontal axis on a histogram is continuous, whereas bar charts can have space in between categories.
Just like boxplot(), you can plug the data right into the hist() function. The breaks argument indicates how many breaks on the horizontal to use.
# Histogram hist(crime.new$robbery, breaks=10)
Look, ma! It's not a a bar chart.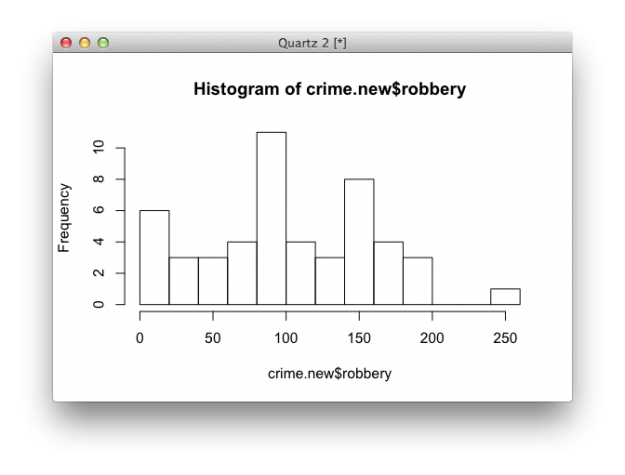
Using the hist() function, you have to do a tiny bit more if you want to make multiple histograms in one view. Iterate through each column of the dataframe with a for loop. Call hist() on each iteration.
# Multiple histograms par(mfrow=c(3, 3)) colnames <- dimnames(crime.new)[] for (i in 2:8) { hist(crime[,i], xlim=c(0, 3500), breaks=seq(0, 3500, 100), main=colnames[i], probability=TRUE, col="gray", border="white") } Using the same scale for each makes it easy to compare distributions.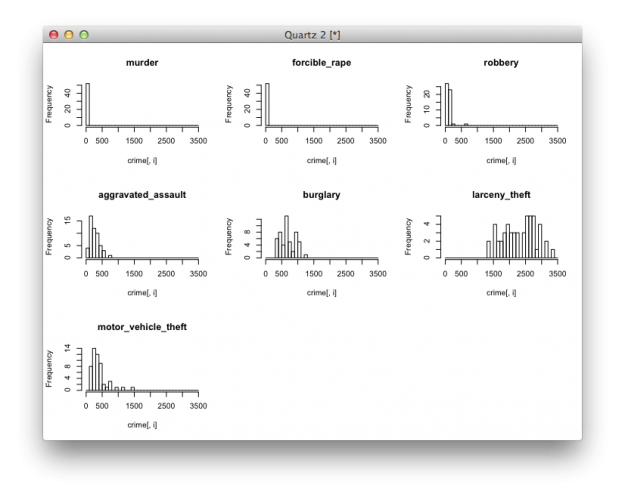
Density Plot
For smoother distributions, you can use the density plot. You should have a healthy amount of data to use these or you could end up with a lot of unwanted noise.
To use them in R, it's basically the same as using the hist() function. Iterate through each column, but instead of a histogram, calculate density, create a blank plot, and then draw the shape.
# Density plot par(mfrow=c(3, 3)) colnames <- dimnames(crime.new)[] for (i in 2:8) { d <- density(crime[,i]) plot(d, type="n", main=colnames[i]) polygon(d, col="red", border="gray") } Multiple filled density plots.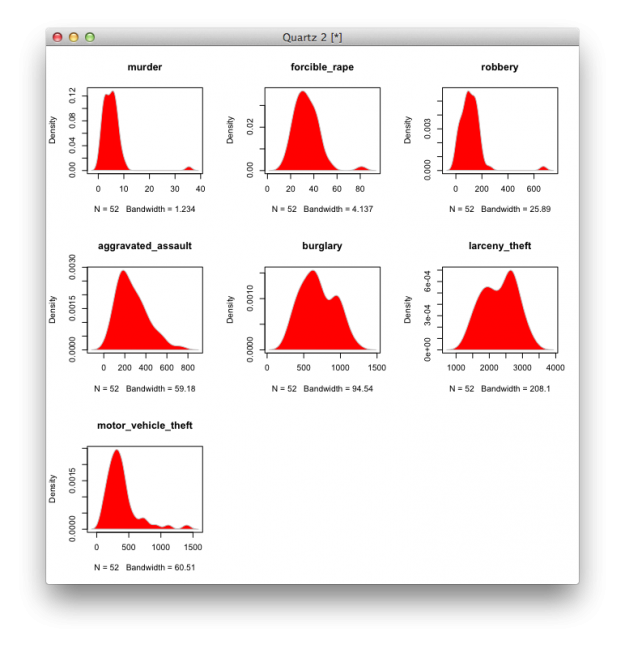
You can also use histograms and density lines together. Instead of plot(), use hist(), and instead of drawing a filled polygon(), just draw a line.
# Histograms and density lines par(mfrow=c(3, 3)) colnames <- dimnames(crime.new)[] for (i in 2:8) { hist(crime[,i], xlim=c(0, 3500), breaks=seq(0, 3500, 100), main=colnames[i], probability=TRUE, col="gray", border="white") d <- density(crime[,i]) lines(d, col="red") } Histogram and density, reunited, and it feels so good.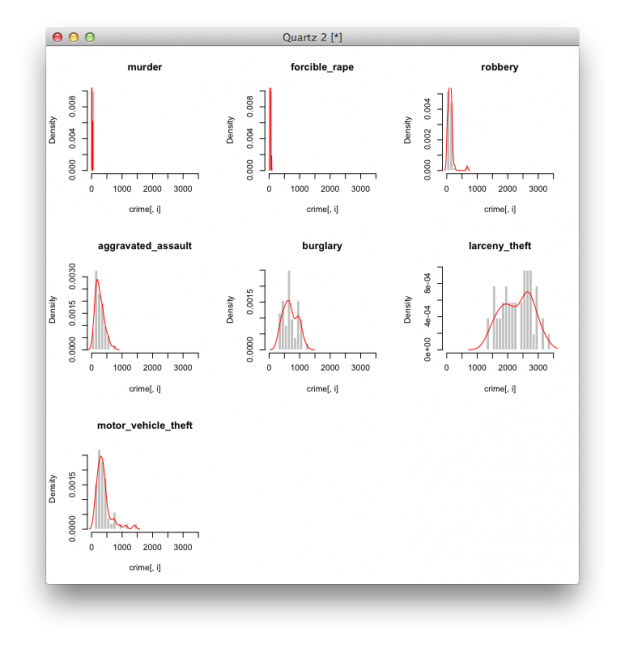
Rug
The rug, which simply draws ticks for each value, is another way to show distributions. It usually accompanies another plot though, rather than serve as a standalone. Simply make a plot like you usually would, and then use rug() to draw said rug.
# Density and rug d <- density(crime$robbery) plot(d, type="n", main="robbery") polygon(d, col="lightgray", border="gray") rug(crime$robbery, col="red")
Using a rug under a density plot.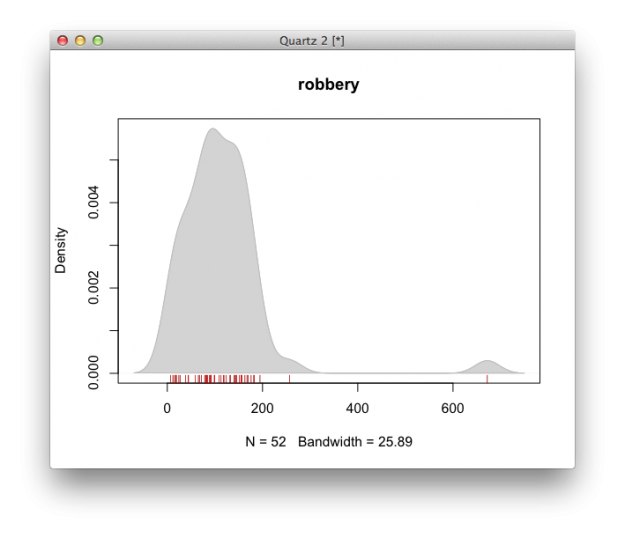
Violin Plot
The violin plot is like the lovechild between a density plot and a box-and-whisker plot. There's a box-and-whisker in the center, and it's surrounded by a centered density, which lets you see some of the variation.
# Violin plot library(vioplot) vioplot(crime.new$robbery, horizontal=TRUE, col="gray")
I bet this violin sounds horrible.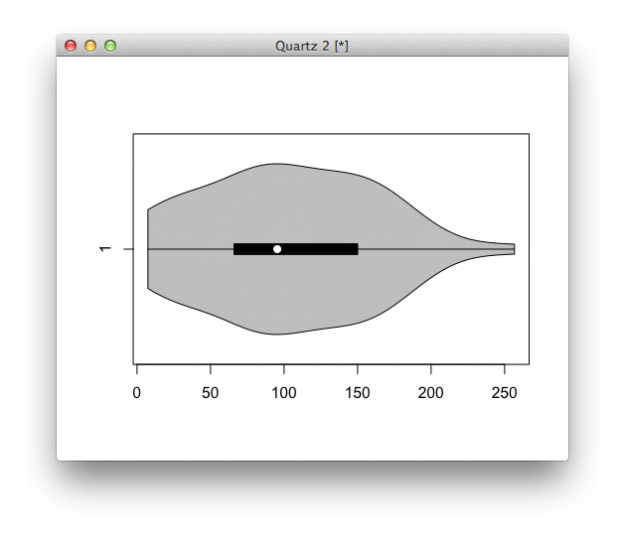
Bean Plot
The bean plot takes it a bit further than the violin plot. It's something of a combination of a box plot, density plot, and a rug in the middle. I've never actually used this one, and I probably never will, but there you go.
# Bean plot library(beanplot) beanplot(crime.new[,-1])
A little too busy for me, but here you go.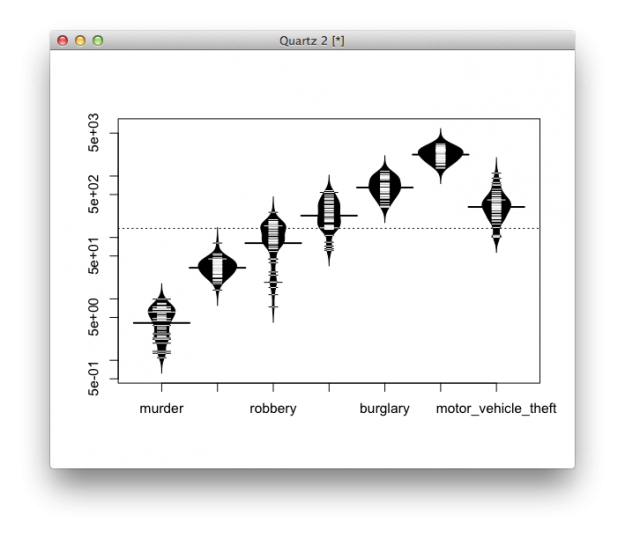
Wrapping Up
If you take away anything from this, it should be that variance within a dataset is worth investigating. Picking out single datapoints or only using medians is the easy thing to do, but it's usually not the most interesting.
Related

ITP Spring Show: Iraq war and diabetes visualizations
May 15, 2012 03:15 am • Permalink 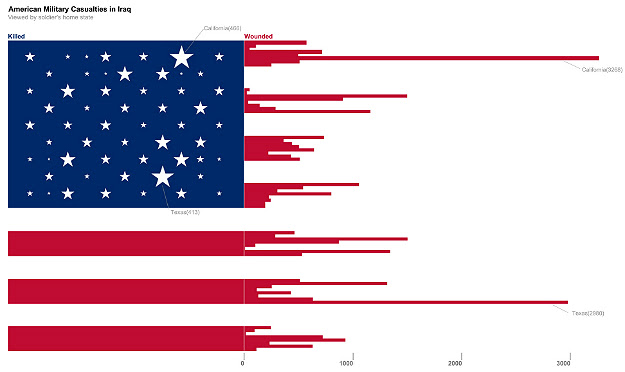
Yesterday I visited the ever popular NYU ITP bi-annual show which is a showcase of the students' experimental and ingenious interactive work.
I stopped to talk to data visualization student and self-tracker, Doug Kanter, about his work. His first and smaller piece was about the war in Iraq. The image above depicts the number of wounded US soldiers by state (and territory) using the red stripes. The stars show the number of soldiers killed. I'm sure we could quibble about labels and where the bar chart starts, but to me, the tattered appearance of the flag created by data about war is very arresting.
Doug's more developed work dealt with his self-tracked health data. He's a type-1 diabetic and monitors his blood glucose, insulin dosage, and diet among other things. His visualization showed three months worth of data by which he says he was able to see how a low-carb diet helped keep his blood sugar in check. Doug's blog post detailing his process and visualization is worth a read.
The ITP Spring Show runs through this evening at 721 Broadway in NYC. Over 100 projects are on display making this a must see of interactive innovation.

No comments:
Post a Comment