Gay rights in the United States, by state
May 09, 2012 12:33 am • Permalink 
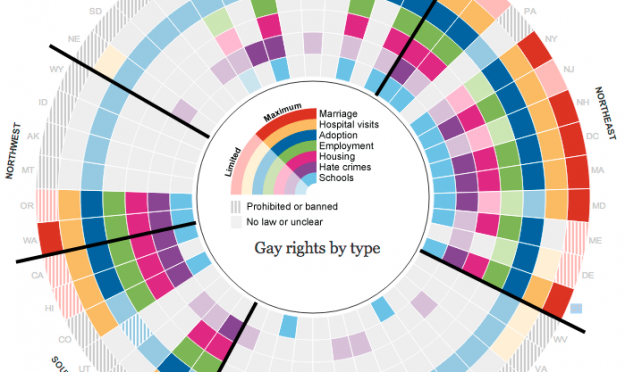
Gay rights vary across states and by region. The Guardian US interactive team does their research and shows this variance, covering several issues, from school to marriage. Segmented concentric circles make the foundation of the interactive where each circle is an issue, and each segment is a state. The states are organized by region, so it's easy to see where areas of the country stand.
Be sure to scroll down for regional breakdowns by issue.
Nice work from both a technical and storytelling standpoint.

United Stats of America series premier tonight
May 08, 2012 03:52 pm • Permalink  The series premier of United Stats of America (See what they did there?) on History is tonight at 10/9c.
Episodes explore the stats that help us understand how much money we make (and what we spend it on), how long we will live (and how we will die), what we do with our free time (and how to make more of it) and a whole lot more. In one episode, the Sklars explain how the deadliest animal in America is neither the snake nor the shark but rather the deer. In another, viewers learn that Americans waste 4.2 billion hours a year stuck in traffic and that, in a nation with over 3.5 million square miles of territory, 99 percent of us are crowded into only 8 percent of the land.
I watched a couple of clips and got bored quickly as they went through a bunch of numbers. It seems like a rehash of Yahoo and Huffington Post lists with jokes. I'm setting my expectations low, but maybe there'll be more to it in the full episodes.
[Thanks, Gary]

Neighborhood boundaries based on social media activity
May 08, 2012 10:00 am • Permalink 
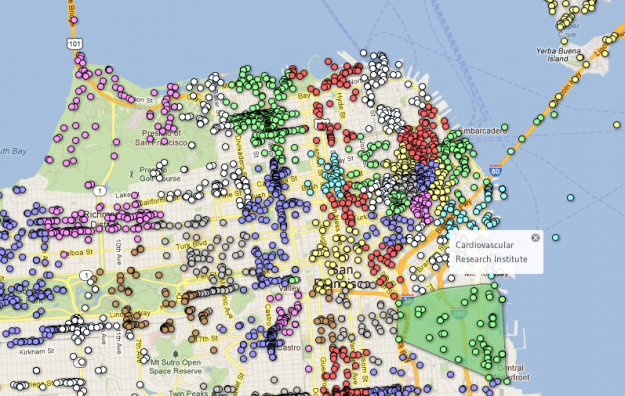
Researchers at the School of Computer Science at Carnegie Mellon University investigate the structure of cities in Livehoods, using foursquare check-ins.
The hypothesis underlying our work is that the character of an urban area is defined not just by the the types of places found there, but also by the people who make the area part of their daily routine. To explore this hypothesis, given data from over 18 million foursquare check-ins, we introduce a model that groups nearby venues into areas based on patterns in the set of people who check-in to them. By examining patterns in these check-ins, we can learn about the different areas that comprise the city, allowing us to study the social dynamics, structure, and character of cities on a large scale.
It's most interesting when you click on location dots. A Livehood is highlighted and a panel on the top right tells you what the neighborhood is like, related neighborhoods, and provides stats like hourly and daily pulse and a breakdown location categories (for example, food and nightlife). Does foursquare have anything like this tied into their system? They should if they don't.
There's only maps for San Francisco, New York City, and Pittsburgh right now, but I'm sure there are more to come.
Want more on the clustering behind the maps? Here's the paper [pdf].


 The series premier of

No comments:
Post a Comment